Borehole/well schematics in matplotlib
well-schematics is a package to help with making schematic diagrams of the construction
of boreholes and wells in matplotlib.
The project’s homepage is at GitHub.
Usage
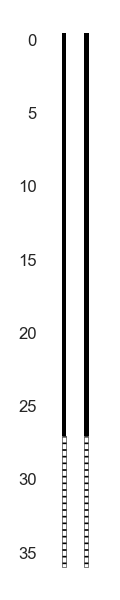
>>> from well_schematics import draw_simple
>>> draw_simple(pzone_top=27, pzone_bottom=36, casing_top=-0.5, pzone_type="S")
Docstrings
-
well_schematics.draw_simple(pzone_top, pzone_bottom, casing_top=0, pzone_type='S', ax=None, tight_layout=True, depth_tick_markers=False)[source]¶ Draw simple well schematic.
Parameters: - pzone_top (float) – top of the production zone
- pzone_bottom (float) – bottom of the production zone
- casing_top (float) – top of the casing
- pzone_type (str) – either “S” for screen, “SC” for slotted casing, or “OH” for open hole.
- ax (matplotlib.Axes) – to draw in
- tight_layout (bool) – run tight_layout() on ax.figure to rearrange things to fit.
- depth_tick_markers (bool) – show tick markers for the vertical depth axis. Labels will always appear.
The simple model used here assumes that a well consists of solid casing of one diameter from top, and then immediately below that, one type of production zone, of the same diameter.
Returns: a list of the artists created.